SuperchartinEvidence and ThoughtHow to Embed Data Visualizations into WordpressBusinesses of all sizes are integrating data analytics into various systems and processes, including their public-facing websites. Data…11 min read·May 10, 2023----
SuperchartinEvidence and ThoughtHow to Create an Analytics Dashboard in WebflowBusinesses of all sizes are integrating data analytics into various systems and processes, including their public-facing websites. Data…11 min read·May 10, 2023----
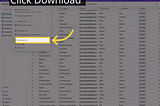
SuperchartinEvidence and ThoughtCan You Export Airtable to Excel?Airtable is a highly versatile tool that offers impressive capabilities. It generally exceeds user expectations in ease of use and…2 min read·May 10, 2023----
SuperchartinEvidence and ThoughtHow To Create a Bar Chart in Google Sheets — SuperchartBar charts are the most frequently used data visualization. Bar charts are great visualizations to compare categories or groups within a…4 min read·May 10, 2023----
SuperchartinEvidence and ThoughtHow To Create a Scatter Plot Using Google Sheets — SuperchartScatter plots plot two sets of data points on an x-y coordinate plane, making it easy for users to identify correlations. They can help…3 min read·May 10, 2023----
SuperchartinEvidence and ThoughtWhat is Airtable Used For — SuperchartAirtable is a versatile tool that can be used for a variety of purposes. For instance, some of the most common use cases for Airtable are…2 min read·May 10, 2023----
SuperchartinEvidence and ThoughtAirtable Basics — SuperchartThe very basics of Airtable. Mostly definitions and a quick summary of the major elements. If you’re looking for more how-to’s and visual…9 min read·May 10, 2023----
SuperchartinEvidence and ThoughtWhy Airtable? — SuperchartAirtable is a powerful cloud-based database platform that makes it easy to organize, store and collaborate on data. It combines the…3 min read·May 10, 2023----
SuperchartinEvidence and ThoughtHow to Make a Pie Chart in Google Sheets — SuperchartGoogle Sheets’ pie charts are a great way to showcase how categories (or slices of the pie) contribute to a larger whole. Not only do they…2 min read·May 10, 2023----
SuperchartinEvidence and ThoughtHow to Make a Chart in Google Sheets — SuperchartCreating charts on Google Sheets is a useful way to visualize and interpret data. This platform offers users the ability to rapidly build…5 min read·May 10, 2023----